Page 1 of 1
Profiler for VMD
Posted: Sun Dec 22, 2024 10:29 pm
by UrbanCyborg
Okay, looks like no one here's familiar with VisualVM, so I'll expand the question. What profiler do you use with VMD? Free, preferably. Thanks.
Reid
Re: Profiler for VMD
Posted: Mon Dec 23, 2024 12:25 pm
by utdgrant
I've never gone as far as running a profiler against VMD. I keep holding out for CA to provide a CPU meter so that we can see real-world performance of individual modules and entire patches within the live VM environment.
Sorry I can't be any more help.

Re: Profiler for VMD
Posted: Mon Dec 23, 2024 4:44 pm
by ColinP
A couple of previous threads on this subject...
viewtopic.php?p=794&hilit=profiling#p794
viewtopic.php?p=3872&hilit=profiling#p3872
I use the SidebarDiagnostics tool for general performance monitoring.
To try and get a handle on individual code segments I use calls to System.nanoTime(). It's fairly crude but better than nothing. If you can somehow multiply the load you should be able to get better results as the resolution isn't really in nano seconds.
https://docs.oracle.com/javase/8/docs/a ... l#nanoTime
Re: Profiler for VMD
Posted: Tue Dec 24, 2024 9:07 am
by Aarnville
When I first started I spent a bit of time with Visual VM but I found it a bit flaky and unpredictable.
These days, like Colin, I mostly just use the system time to get a feel for how long key functions take (typically the stuff that is in ProcessSample). For more complex stuff I have been known to develop the core of the code in a completely separate environment, in my case NetBeans. That gives you a feel for your code bottlenecks but it's hard to incorporate the real-time aspect of VMD so it can be of limited use. Plus, of course, you have to install, maintain and learn a whole different environment.
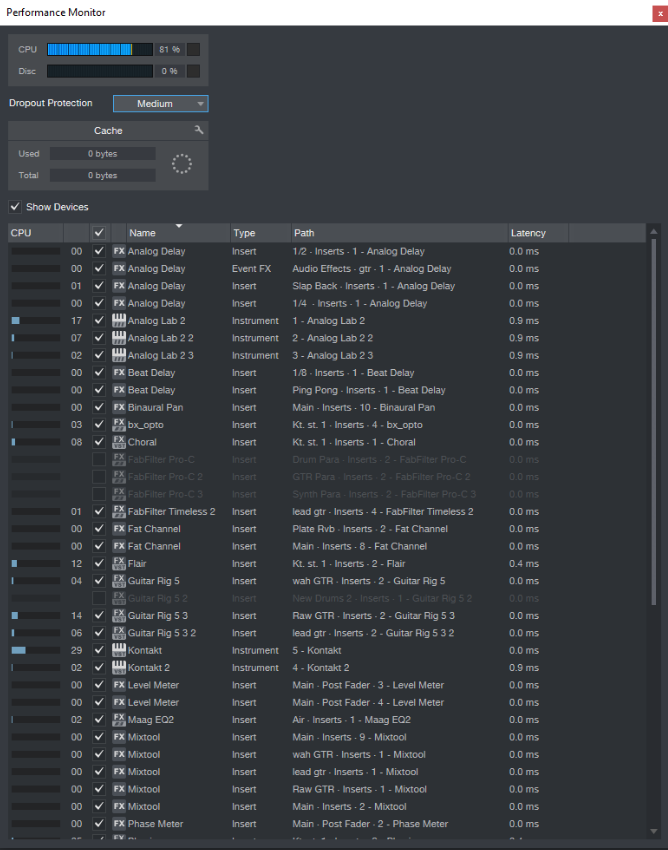
It would be brilliant if VM could have a built-in CPU meter on a per module basis. I use Studio One as my main DAW and it can show you the breakdown of CPU usage per plugin like this:
Re: Profiler for VMD
Posted: Fri Dec 27, 2024 1:35 am
by UrbanCyborg
Thanks to all who responded to this (Wer, wenn ich schriee, hörte mich denn aus der Engel Ordnungen?

) The problem I'm having with VisualVM is that it won't attach to the JVM interface for VMD. I haven't tried it with VM, as the module I want to test isn't published yet. I gather that VisualVM used to be part of the JDK, but got dropped at some point for reasons that passeth understanding. You'd think the JDK would have a profiler, or that a Java interpreter would. Ah, well. As I say, thanks. I thought that others here might be using profilers, but it is what it is.
Reid
Re: Profiler for VMD
Posted: Fri Dec 27, 2024 7:44 am
by Aarnville
UrbanCyborg wrote: ↑Fri Dec 27, 2024 1:35 am
Thanks to all who responded to this (Wer, wenn ich schriee, hörte mich denn aus der Engel Ordnungen?
) The problem I'm having with VisualVM is that it won't attach to the JVM interface for VMD. I haven't tried it with VM, as the module I want to test isn't published yet. I gather that VisualVM used to be part of the JDK, but got dropped at some point for reasons that passeth understanding. You'd think the JDK would have a profiler, or that a Java interpreter would. Ah, well. As I say, thanks. I thought that others here might be using profilers, but it is what it is.
Reid
You can publish a module under development from VMD at any stage and it gets added to your personal module library and can be used by you in VM, and presumably VisualVM. The module stay private to you until you get it approved and published via the Nebula dashboard. I have a bunch of diagnostic and test modules in that state. They'll never be released to the public but I use them for testing other modules under development.